Last week the S&P 500 barely moved closing the week at 4124 which was off just 12 points from the close the previous week–.2% loss on the week. The range for the week was incredibly tight as well at 4098 to 4154. The closer we get to June 1 the more likely this market takes a tumble (debt ceiling).
Interest rates closed at 3.46% (the 10 year treasury)–which was about 2 basis points higher than the close the previous Friday. The range of trading was a bit wider at 3.34% to 3.53%.
The Fed balance sheet fell by $60 billion last week as maturity runoffs and bank crisis funding repayments are driving the balance sheet back toward the early March level.
Last week we had the consumer price index (CPI) and the producer price index (PPI) released with both at or a little below forecast. This means a couple check marks in the ‘pause’ camp for a potential Fed Funds rate hike in June. Plenty of data remains to be seen in the next 3 weeks or so.
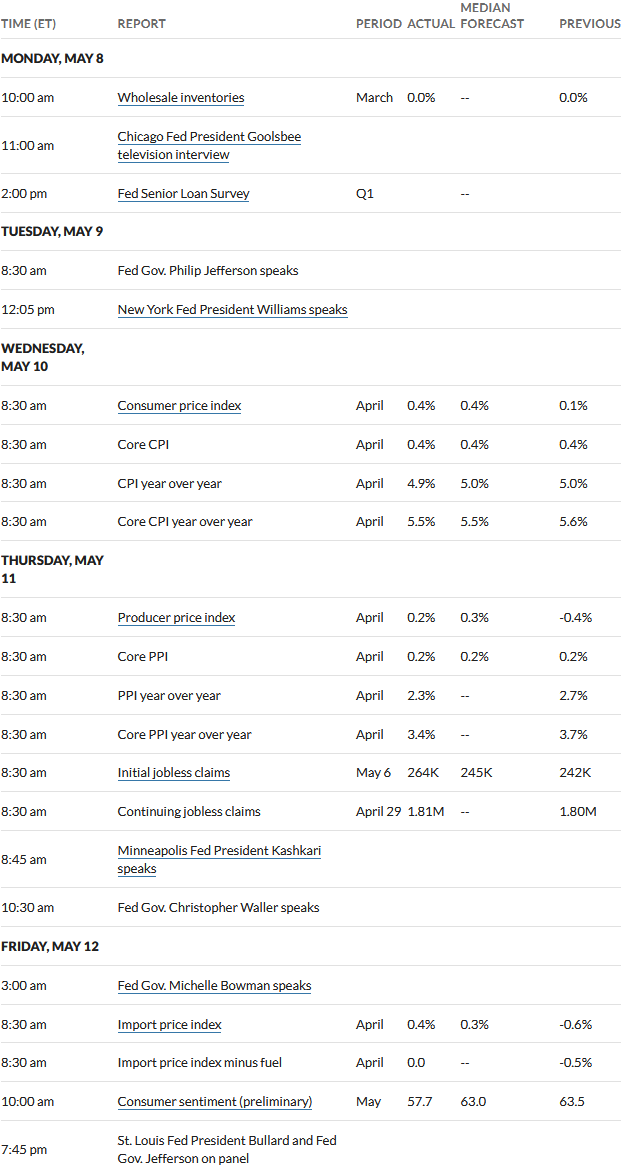
This week we do not have much in the way of major economic news – lots of secondary in importance items and lots of Fed yakkers so I suspect we may look back on this week and say it was a tight trading range once again.

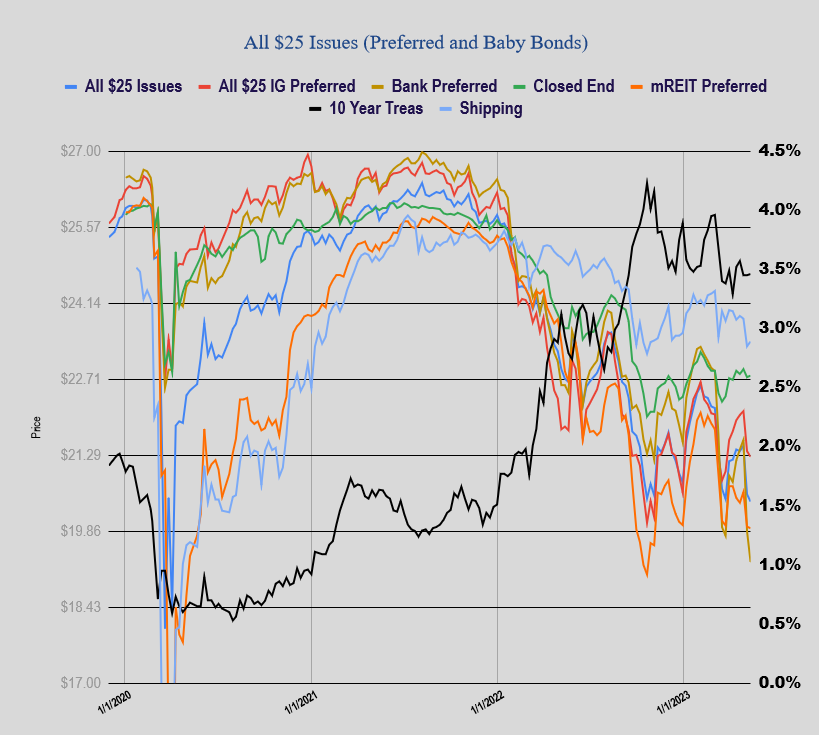
Last week the average $25/share preferred and baby bond stabilized (kind of) from the previous weeks drubbing – average share off 14 cents, investment grade off 11 cents, banks off 59 cents, mREITs off 3 cents and shippers up 9 cents.
Once gain no new income issue priced last week.
Morning – Anyone buying the TDS/PV or UZD here?
The TDS/V approaching 15% – I dont understand the yield, even though the company is losing money, between a dividend cut or asset sale, it seems like they have plenty of options if they want to turn cash flow positive?
What am I missing?
FYI…
With Libor going away, some prefs have a get-out clause and can convert from FF to fixed. MS.E is an example (and two other MS prefs). I own the MS prefs and it looks like a non-event price-wise. MS.E is to be fixed at 7%+.
Not many have this loophole, but you never know.
I’ve been creamed lately with fixed income, but may buy more if I can stomach it, which usually means a good time to buy (or throw up).
You are not alone RickS. Thankfully, some of my current losers are notes (e.g., RILYN) that — as long as the company doesn’t go bankrupt — will return to par or are FTF (RITM-D) that will float off 5-year treasury that may get called.
Hi Tim,
I’m confused in the above graph why you have the 10 yr Treasury scale (the right hand side of the graph) INCREASING in yield (prices decreasing) as you go up. Wouldn’t it be more helphful to reverse this, so yields DECLINE as you go up? That way, Treasuries would be comparable (apples to apples) to the preferred scale on the left-hand side. As the graph is currently configured, when preferreds go up in price, UST’s go down in price, so the two lines work inversely to each other. Of what use it that, if one (generally) uses a graph to compare things to each other?
That’s actually an interesting question RF. Your example would express the “correlation” between UST%/$PFD; maybe evidencing on/off pfd risk premiums relative to the UST% line.
You did answer your own question though I think in that the graph is meant to provide a snapshot of the general inverse relationship between UST% and $PFD.
Now if only we could have a graph that can see the future…
BTW: Notice the best buys are “below” the UST% line – where most people are selling. 🙂
Isn’t that pretty much everything alpha
If you’re referring CM to buying “below the line” – yes, that’s everything. Looking at Tim’s graph, at least 90% of our buys are below that border as I’m not smart enough to navigate the area north of it. Bouts of heavy buying punctuated by years of boredom.