This morning the Atlanta Fed GDPNow model was updated.
The next update will be on Thursday of this week.
6/17/2025
Our site runs on donations to keep it running for free. Please consider donating if you enjoy your experience here!
This morning the Atlanta Fed GDPNow model was updated.
The next update will be on Thursday of this week.
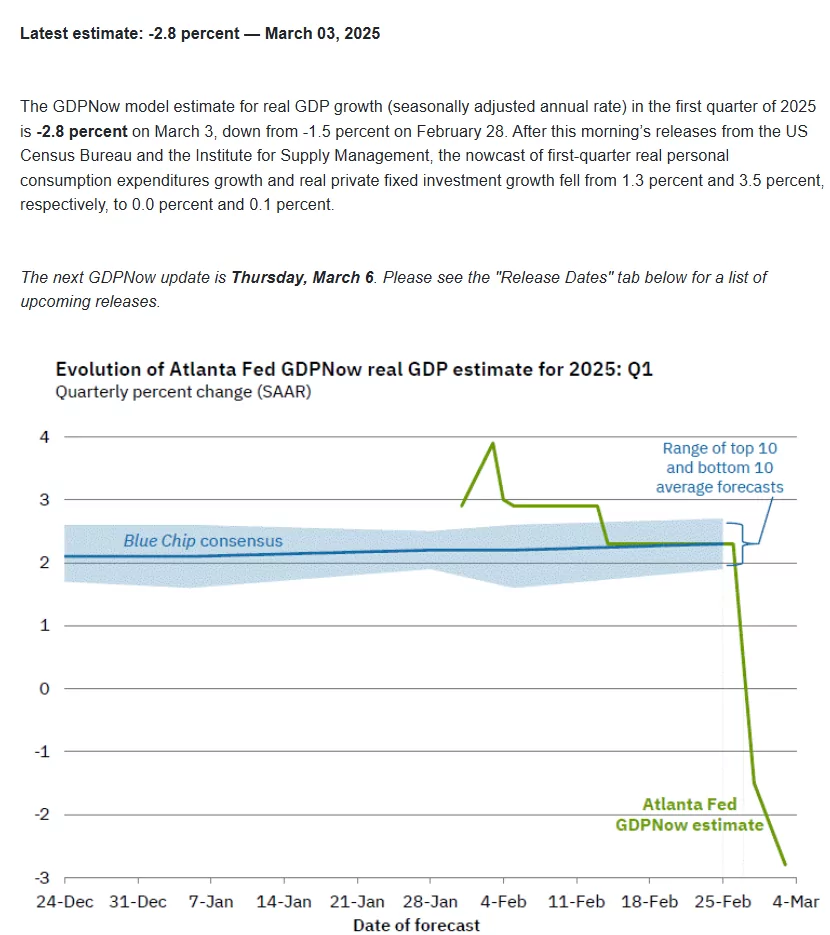
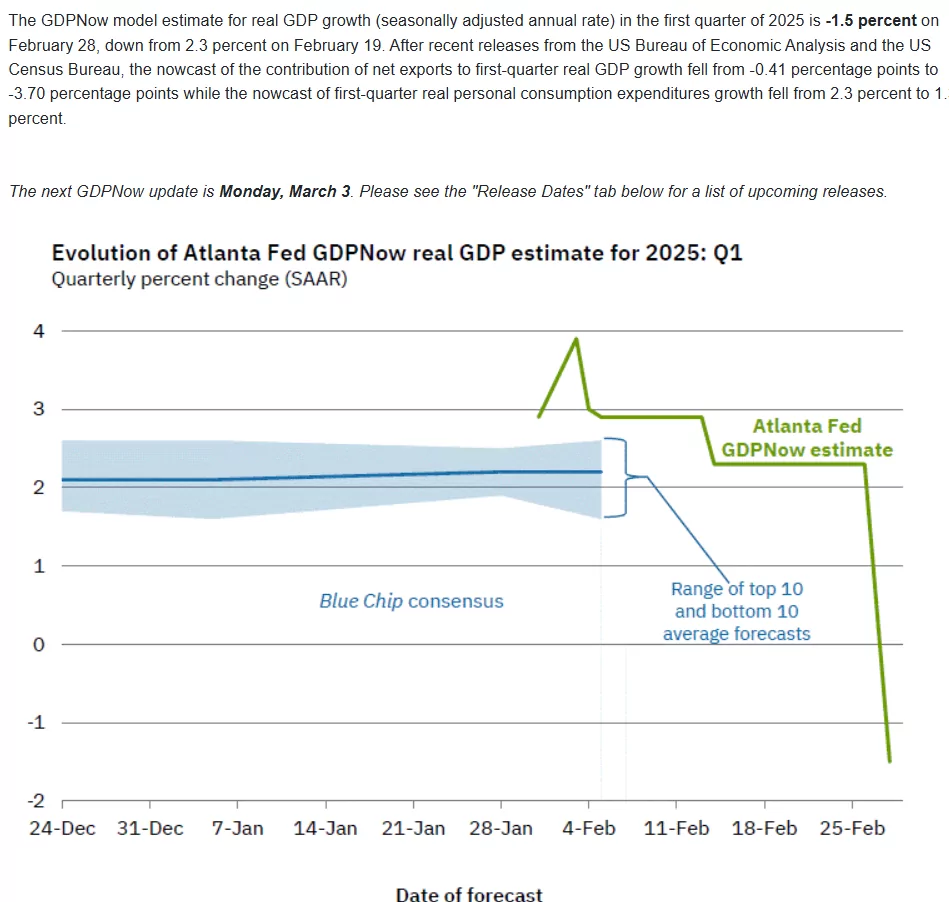
Yesterday the Atlanta Fed updated their GDPNow forecast with a dramatic drop for the 1st quarter. This tool is updated every few days and the next update is on Monday 3/3/2025.
Can the economy drop off the cliff that fast? Guess we will have to wait and see.
Further reading is here.
The 10 year treasury has moved higher today–up to 4.69% after the release of the Institute of Supply Management (ISM) report showing strong performance in the service sector. The pricing index showed a sharp increase which put the hammer on equities. The report is here. Normally these reports don’t represent importance–but as always, subject to change, so now they are important.
JOLTs (job openings and labor turnover) was also released and the numbers were much stronger than forecast with about 8.1 million job openings versus a forecast of 7.7 million and last months reading of 7.84 million.
Preferreds and baby bonds are off a bit–although thus far the damage is minimal.
I have mentioned many times recently that I am going to scrutinize economic data closely for the next few months–or maybe all year long. There are times when we are in a very ‘Goldilocks’ environment when one can skip the intense look at data–I don’t think this is one of those times, although the numbers have tended toward a stable environment. With a new President and soon to be all new departments heads we could have news that drives interest rates all over the map–I hope not–who needs the stress? The only good part of that stress at this point in time is one can ‘bail out’ to CDs and MMs right now at 4+% if necessary (subject to change of course).
So last week, being another holiday week, sh were short on truly meaningful economic news–and for that matter it was short on company news.
We had the Chicago Business Barometer–this is really a purchasing managers index for just the Chicago area. The number came in soft at 36.9 versus a forecast of 42.2 and last months reading of 40.2. This number has been published since 1967 and had a low of 20.7% in 1980 and a high of 81 in 1973. The all time average is around 54–so a fair conclusion is that Chicago area purchasing managers are kind of in the dumps. We’ll watch the future and see if this is a meaningful number.’
We had the ‘pending home sales’ released from the National Association of Realtors which came in at up 2.2% compared to a forecast of .7%. From my observation most potential buyers have gotten used to the 7% mortgage rate–memories are short in the United States. It is interesting that the supply of NEW HOUSES is zooming higher–at 8.9 months supply. This is up from the most recent low supply number in 2020 which was a 3.3 month supply. The recent high level prior to the current number was in October, 2022 at 10.6 months supply. I am thinking (right or wrong) that if inventory grows much more–maybe to 10 months or more we are going to see issues in the housing markets. Housing is a large sector and affects lots of sectors from building supplies to furniture. This is one to watch. This info is from the St Louis Fed and can be seen here.
The weekly 1st time unemployment numbers were released last Thursday. The numbers were 211,000 which was quite a lot under the 225,000 expected. This number continues to remain fairly good–although if it falls much from here one would think there would be a fear of wage inflation. I think this number is suspect–the holidays may well make these unreliable – we’ll see if this get large revisions next week.
The Institute of Supply Management (ISM) released their month survey at a 9 month high of 49.3%–anything under 50 indicated contraction in manufacturing while above is expansion. Kind of ‘Goldilocks’ I guess.
GDPNow which is calculated by the Atlanta Fed is now showing growth of 2.4% in the 4th quarter of 2024 which is trending lower–which has been the case since mid December. The Atlanta Fed calculates this number every business day with new data. The data can be seen here.
My weekly conclusion is that the most recent economic data is not hot and not cold–Goldilocks, but a number of items bear watching.
The CLO owner company’s – Eagle Point Credit, Oxford Lane etc, hold portfolios of leveraged loans–loans to company’s rated BB or lower. As such I watch the data on the overall collateralized loan obligation (CLO) market whenever I can find it.
Here is an article from S&P Global on defaults etc in the leveraged loan sector. It is one of the best overviews of the market that I have seen in quite a while.